
Best API Monitoring Tools for DevOps
Compare the best API monitoring tools for DevOps, SRE, and engineering teams by testing depth, integrations, alerts, security, and fit.
API monitors can tell you an endpoint is up while a checkout flow is still broken. The hard part is finding a tool that checks the right layer, sends useful alerts, and fits your delivery workflow. Here are six API monitoring tools, with the best fit and the trade-offs for each.
1. EnvManager
EnvManager is a self-serve platform for encrypted, version-controlled environment files. It fits DevOps teams that need API credentials in local development and CI/CD without passing secrets around by hand.
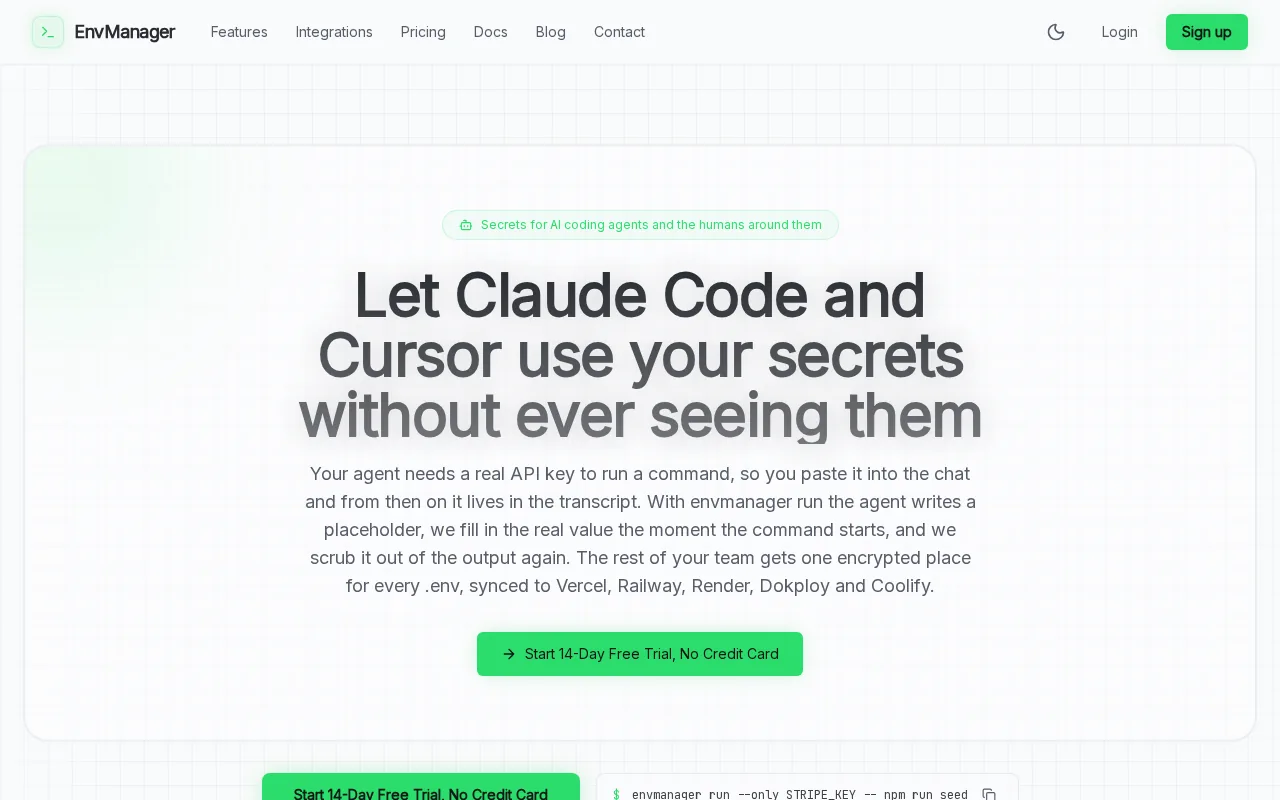
We encrypt every value with AES-256 on import. Role-based access control, or RBAC, limits who can view or change a secret. Version history shows what changed, while an immutable audit trail records the action for later review.
That matters when an API monitor needs a token, client secret, or private endpoint credential. You can sync approved values to a developer machine or pipeline without placing them in source code. JIT access can also give a user temporary access instead of leaving a permanent secret exposed.
EnvManager belongs beside API monitoring, not inside the monitor itself. It manages the secret that a test needs. The monitor checks response time, status, payloads, and transaction behavior.
Teams comparing API authentication best practices should treat credential storage as part of test design. A failed test is useful. A leaked test token is not.
The caveat is scope. EnvManager doesn't replace synthetic checks, real-user monitoring, traces, or incident routing. It protects the configuration layer that those systems depend on. Start by moving one shared API credential out of a local .env file.
2. Catchpoint, Broad synthetic and real-user API visibility
Catchpoint is a wide-scope monitoring platform for teams that need API checks alongside network and digital experience data. It suits large enterprises, cloud providers, and teams responsible for customer traffic across many regions.
Its stated monitoring coverage includes synthetic tests, real-user data, network intelligence, and endpoint monitoring. That combination helps a team ask a better incident question: did the API fail, or did a DNS path, ISP, CDN, or other network layer slow the request?
Catchpoint also describes intelligent agents in global locations and enterprise agents inside a private network. That setup can help compare an endpoint's public behavior with its internal behavior. A team supporting a global service may need both views before it assigns an incident to application engineering.
The trade-off is breadth. A wide monitoring surface can produce more context, but it may require more setup and clear ownership. The available product information also doesn't spell out a starting price or detailed alert rules. Ask for a live test that covers your key endpoint and incident path.
For teams that need to see the Internet path around an API, Catchpoint is the strongest breadth pick. For a smaller service with one internal endpoint, it may be more platform than you need.
3. Kentik, Secure authenticated endpoint testing
Kentik is a synthetic API monitoring option for NetOps, DevOps, and SRE teams. Its key advantage is secure credential storage for authenticated endpoint tests, so teams don't have to hard-code secrets into test definitions.
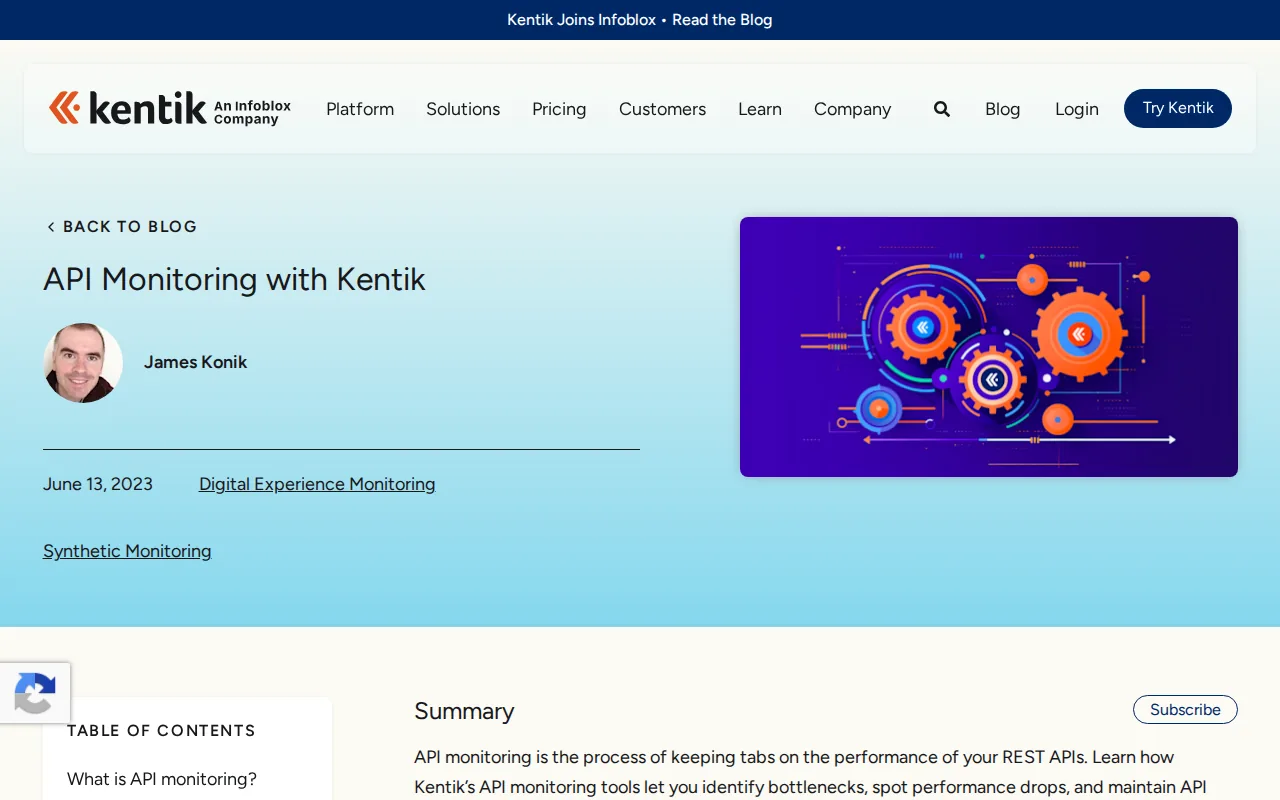
Synthetic monitoring can run scheduled checks from different vantage points. It tracks availability, latency, and error rates. Network telemetry helps teams separate an application issue from a connectivity or ISP problem.
That split is useful during a production incident. Suppose an authenticated request slows only for users in one region. A synthetic test can show the regional pattern, while network data can help determine whether the endpoint or the path is at fault.
API monitoring can support payment flows, healthcare systems, logistics services, and connected devices. The same idea applies to any service where a slow or failed API call breaks a larger transaction.
API monitoring tools still need safe handling of tokens. An encrypted secret store is better than putting a bearer token in a script, repository, or CI variable with broad access. This is where EnvManager can sit beside Kentik in a controlled workflow.
Kentik lists a free trial, but public product information does not provide a starting price. It also focuses on synthetic monitoring. You won't get the same direct view of actual user sessions that a real-user monitoring product provides. Choose it when authenticated tests and network context matter more than broad user telemetry.
4. LogicMonitor, API testing with DevOps integrations
LogicMonitor combines API testing and monitoring on one platform. It fits DevOps teams that want checks to run before release and continue after deployment.
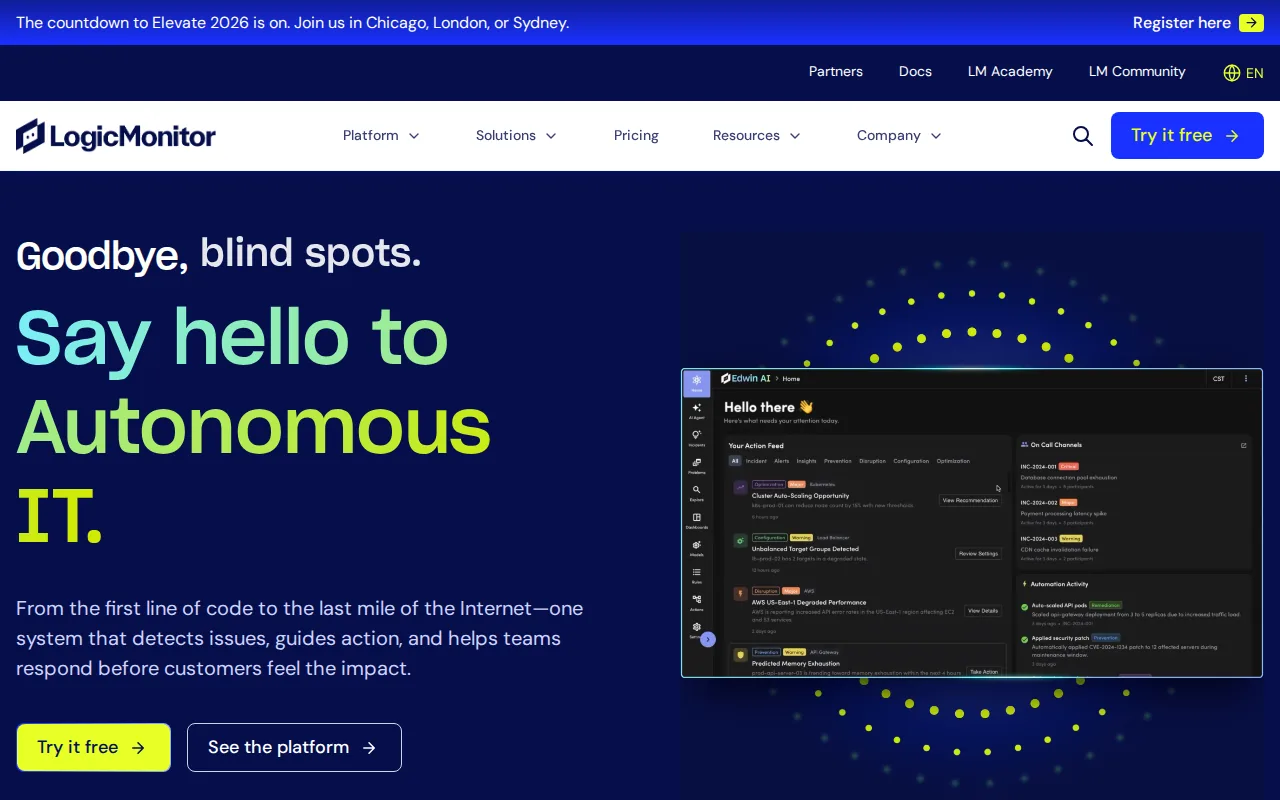
A basic 200 response doesn't prove an API works. Response validation can reveal an endpoint that returns a success code with missing fields or bad business data.
The platform supports synthetic monitoring and lists integrations with Jenkins and GitHub. A team can place an API check in a delivery flow, then keep a related check active in production. This creates one thread between a code change and the service behavior that follows it.
Multi-step tests can model a real sequence. First authenticate. Then create or fetch a record. Once the response is validated, continue to the next call. This catches failures that a single availability check misses.
That makes it easier to start an evaluation, but you should still confirm alert thresholds, routing, grouping, and escalation rules.
The limitation is synthetic coverage. Prewritten tests cannot reproduce every request shape or user condition. Keep real traffic data in your wider observability plan. LogicMonitor is a strong fit when release checks and synthetic production tests need to live together.
Before a deployment, run a test that validates the response body, not only the status code. That single change can expose a broken contract earlier.
5. Elastic, Scalable API observability
Elastic uses synthetic monitoring to test applications through scheduled, automated requests. It suits teams already working in Elastic Observability or teams that want synthetic data inside a wider observability system.
Synthetic monitors can run lightweight checks or browser-based journeys. Private locations are useful when an API sits behind a firewall or must be tested from a controlled network.
Browser journeys can test actions such as login, adding an item to a cart, and checkout. For API-focused work, the same principle applies to a multi-step request flow. You test the path a user or service actually needs, rather than checking one isolated URL.
Elastic highlights automatic scaling, built-in security, and integration with Elastic Observability. That can help teams connect a failed synthetic run with logs and other monitoring data in the same working environment.
The main caveat is the nature of synthetic tests. They run from predefined locations with predefined scripts. They can miss unusual user settings, edge cases, and network conditions. Scripts also need updates when an application flow changes.
Elastic is a sensible choice when your team already uses its observability tools and wants API checks in the same view. If you only need a few endpoint checks, its wider system may add more setup than value.
Keep the test script close to the service contract. When the contract changes, update the monitor in the same review.
6. Anypoint Monitoring, Functional and integration-focused monitoring
Anypoint Monitoring focuses on real-time data, logs, functional API checks, and application network health. It fits teams that manage several integrations and need to trace how data moves between applications.

Its dashboards can show real-time and historical data. Distributed tracing follows a request as it moves from one application to another. That context can shorten the search when the first visible error appears far away from the original fault.
Anypoint Monitoring lists response time, error rate, throughput, availability, and resource use as useful metrics. Teams can define logical entities and shape dashboards for different groups. A platform team may watch application health, while an integration team focuses on failed data flows.
Custom alerts are available in the product information, with feature access depending on the selected package. The service also supports telemetry export through the OpenTelemetry standard. That makes it easier to send monitoring data into a wider observability setup.
Teams reviewing API key security practices should pair functional checks with strict token controls. A monitor that can prove a workflow works still needs a safe way to authenticate it.
Anypoint Monitoring lists a 30-day trial.
This is the best fit here for integration-heavy environments. It may be a poor match if your only need is a lightweight uptime check for one public endpoint.
API Monitoring Tools Compared
The right shortlist depends on the failure you need to see first. Catchpoint has the broadest monitoring scope. LogicMonitor emphasizes testing across delivery and production. Kentik adds network context to authenticated synthetic checks. Elastic fits teams already using its observability stack. Anypoint Monitoring focuses on application networks and integrations. EnvManager protects the secrets those tests may need.
| Tool | Best fit | Monitoring focus | Known integration or trial detail | Watch for |
|---|---|---|---|---|
| EnvManager | Teams managing API secrets | Encrypted environment configuration | RBAC, version control, CI/CD sync | Not an endpoint monitor |
| Catchpoint | Global enterprise visibility | Synthetic, real-user, network, endpoint | Broad operations ecosystem | Alert and price details need confirmation |
| Kentik | NetOps, DevOps, and SRE | Synthetic checks with network context | Free trial | Primarily synthetic coverage |
| LogicMonitor | Release and production checks | Synthetic API testing | Jenkins, GitHub, alerts mentioned | Confirm alert workflow depth |
| Elastic | Elastic Observability users | Synthetic and browser journeys | Automatic scaling, built-in security | Scripts need upkeep |
| Anypoint Monitoring | Integration-heavy teams | Real-time, log-based, functional | OpenTelemetry, custom alerts, 30-day trial | Tier-dependent features |
Public information is thin on procurement details. Only LogicMonitor and Anypoint Monitoring clearly mention alerting. Ask each vendor to show the alert rule, notification route, retention period, and expected cost for your test volume.
Don't forget scheduled work around the API. A missed backup or queue job can cause the same downstream failure as a dead endpoint. A separate service such as a cron job monitoring service can cover heartbeat alerts for jobs that API monitors won't see.
FAQ
What are API monitoring tools used for?
API monitoring tools check whether endpoints respond correctly and fast enough for dependent services. They can test status codes, response data, latency, authentication, and multi-step flows. Synthetic checks run on a schedule, while real-user monitoring shows what actual users experience. The best choice depends on which failure type your team needs to catch first.
Which API monitoring tool is best for DevOps?
LogicMonitor is a strong DevOps fit when you want API tests tied to Jenkins or GitHub. Kentik suits teams that need authenticated synthetic checks with network context. Elastic fits teams already using Elastic Observability. EnvManager should manage the credentials used by those tests, but it doesn't replace the monitoring layer.
Can API monitoring tools test authenticated endpoints?
Yes, API monitoring tools can test authenticated endpoints when they support secure credential handling. Kentik specifically describes stored credentials for authenticated tests without hard-coding secrets. Keep tokens outside test code, limit access with RBAC, and rotate them when ownership or scope changes.
What is the difference between synthetic and real-user API monitoring?
Synthetic monitoring sends planned requests from selected locations on a schedule. Real-user monitoring collects data from actual sessions and conditions. Synthetic checks can catch a failure before a customer reports it. Real-user data can reveal problems that fixed scripts miss. Many teams use both when the service is business-critical.
Do API monitoring tools include alerting?
Some API monitoring tools include alerting, but public feature details vary widely. LogicMonitor mentions alerts, and Anypoint Monitoring lists custom alerts. For every vendor, confirm threshold rules, alert grouping, routing, escalation, and noise controls during a trial or product review.
Conclusion
Choose the monitor that matches your first failure question, then test one real workflow before committing. For the surrounding secret problem, start with EnvManager and move one API credential into a controlled, versioned workflow. Next, run an authenticated check through your preferred monitor and review the alert from detection to handoff.